Sample Description
A LENS processed Ti sample with Ni alloy addition made by our collaborators is chosen for this work. The Ni content was compositionally graded - 0% Ni on one end and gradually increases to 20% Ni on the other end. This provided the advantage of assessing mechanic properties of the alloy as a function of composition within the same sample. These deposits were subjected to a series of solutionizing and step quenching heat treatments.
The sample with the following heat treatment was chosen: Solutionize for β at 975°C, subsequently step quenched to 550°C.
Nanoindentation Test
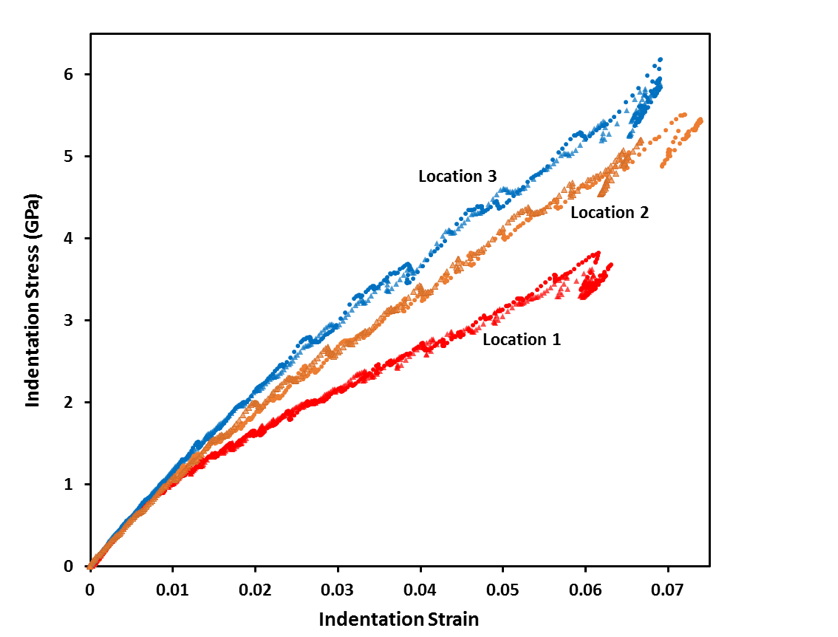
At least two indents were made close to each other at each of the three locations as shown in the schematic (figure 1) with 100 µm spherical diamond tip. The load displacement curves were extracted and converted to Indentation Stress Strain (ISS) curves using the protocols developed previously by our research group. The ISS curves are shown in the figure 2. The data shows that the two indents on each location are consistent with each other. It also displayed the successful implementation of the experimental protocols that were developed at GT.
 figure 1 Sample Schematic
 figure 2 Indentation Stress-Strain Curves from three distinct locations
The ISS curves of the compositionally graded material are compared with each other in figure 2. When comparing the ISS curve among three locations with different chemical compositions, we find that the resistance to plastic deformation increased as nickel composition becomes higher. Hence nano-indentation can be used successfully to extract local mechanical information as a function of composition.
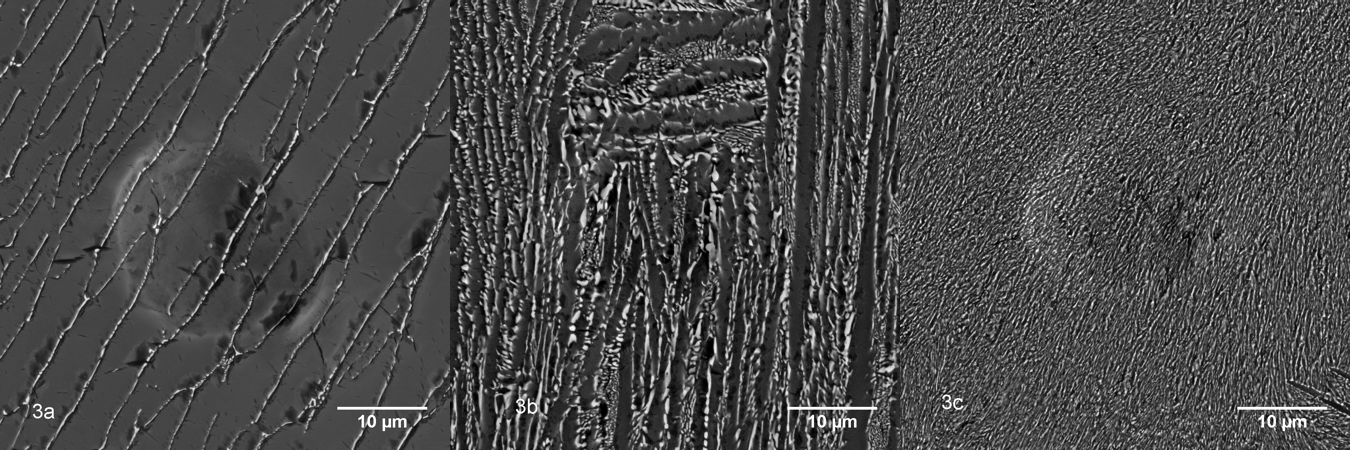
 figure 3 BSE images under indentation areas at three locations
SEM images in the back-scattered electrons (BSE) mode showed at 3(a), 3(b), 3(c) sites of indentation accordingly. According to the phase diagram, when the material with low Ni is step quenched from β to 550°C, the expected microstructure should be alpha Ti, with retained β and Ti2Ni. As the composition moved beyond the eutectoid composition, a higher amount of Ti2Ni intermetallic is expected upon quenching and heat treatment at 550°C. This can also be seen in the figures which show the area beneath the indents. These images show a higher atomic contrast at the alpha lath boundaries, or in between the lamellar structure. This points to the presence of the Ti2Ni intermetallic. Judging from the Ti-Ni equilibrium diagram and the nature of BSE images, the volume fraction of Ti2Ni phase increases from 3(a) to 3(c). It seems that the presence of a mixture of alpha Ti and intermetallic Ti2Ni leads to better strengthening. However, further EDS analysis and EBSD characterization needs to be done to validate this possibility. The crystallographic orientation may also be playing a role in this.