Comparison of MKS Prediction to CPFEM Response for Hexagonal Polycrystals
Introduction
The goal of this study is to demonstrate the capability of the MKS to accurately predict stress and strain fields in the alpha-Titanium materials system. First, the MKS is calibrated for the strain component, then the MKS is calibrated for all of the components of the stress tensor for each of 6 steps of cyclic loading (as in the CPFEM simulations).
CPFEM Simulations
Crystal Plasticity Finite Element Method (CPFEM) simulations were performed to 0.5% strain amplitude over three cycles. The simulation results used in this study are from the first loading segment.
- Microstructure size: 21 x 21 x 21
- Material: Polycrystalline Titanium, alpha phase
- Microstructure type: orientations randomly assigned to voxels in microstructure
- Element Type: C3D8 (strain value in each voxel averaged over all integration points)
MKS Prediction
The materials knowledge system (MKS) was used to predict the elastic response of alpha-Ti polycrystalline microstructures. The MKS was calibrated using a set of 200 microstructures and the associated CPFEM stress and strain fields. Validation was performed using a set of 50 microstructures and the associated CPFEM stress and strain fields.
Calibration Datasets
Two-hundred Calibration microstructures were generated by randomly assigning voxels orientations selected from a pre-determined list of orientations. These orientations were selected from the face of the hexagonal fundamental zone, where and . The selection of this face for calibration is appropriate as the angle has no effect on elastic properties. In addition, the angle does not influence the coefficients generated by the GSH Hexagonal-Triclinic formulation when L = 4. A relatively small set of 96 orientations were selected in order to increase the proportion of high-contrast (in orientation) voxel pairings in the calibration microstructures.
The image below shows the orientations selected for microstructures in the calibration data-set

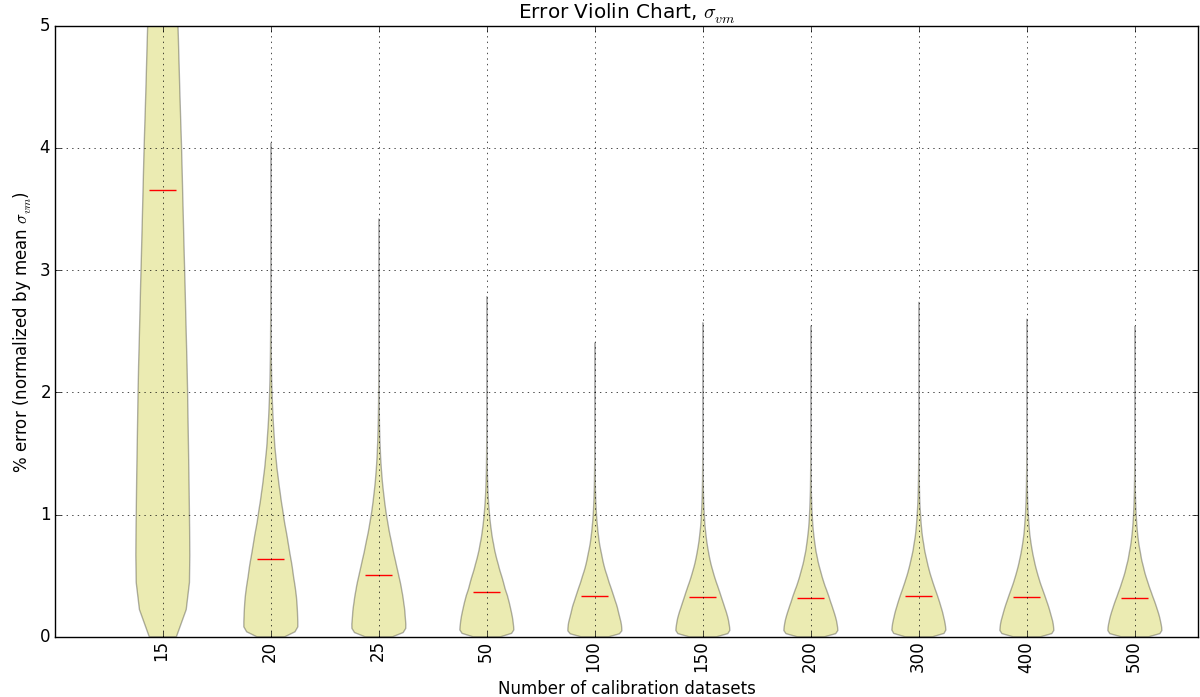
The choice to calibrate with 200 samples was justified through a study comparing the error in validation versus the number of samples used for calibration. The image below is a violin plot showing the error distribution in the validation versus CPFEM results for calibration sets ranging from 20 to 500 samples in size. The red bar in each “violin” is the mean error in von-Mises stress between the MKS prediction and CPFEM response. The thickness of each “violin” at any error level represents the frequency with which that error occurs.
Validation Datasets
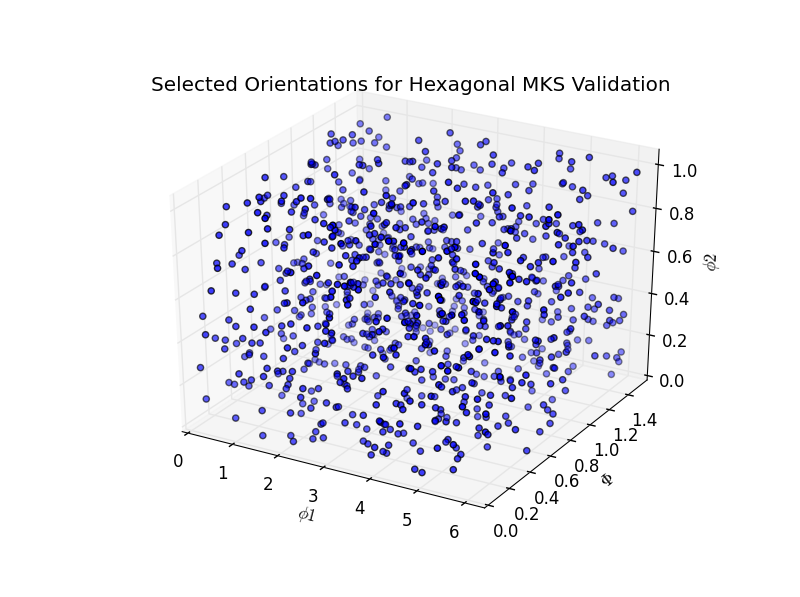
Fifty Validation microstructures were generated by assigning voxels orientations randomly from the hexagonal-triclinic fundamental zone (, , ).
The image below shows orientations assigned to voxels of microstructures in the validation data-set
Results
Calibration for the strain component
The MKS calibration and subsequent validation were successfully performed.
- Mean Absolute Strain Error (MASE) = 0.102%
- Mean maximum error over all microstructures = 0.529%
- Maximum error in any microstructure = 0.753%
- Mean minimum , CPFEM: 0.00462
- Mean minimum , MKS: 0.00460
- Average , CPFEM: 0.00499
- Average , MKS: 0.00499
- Mean maximum , CPFEM: 0.00526
- Mean maximum , MKS: 0.00525
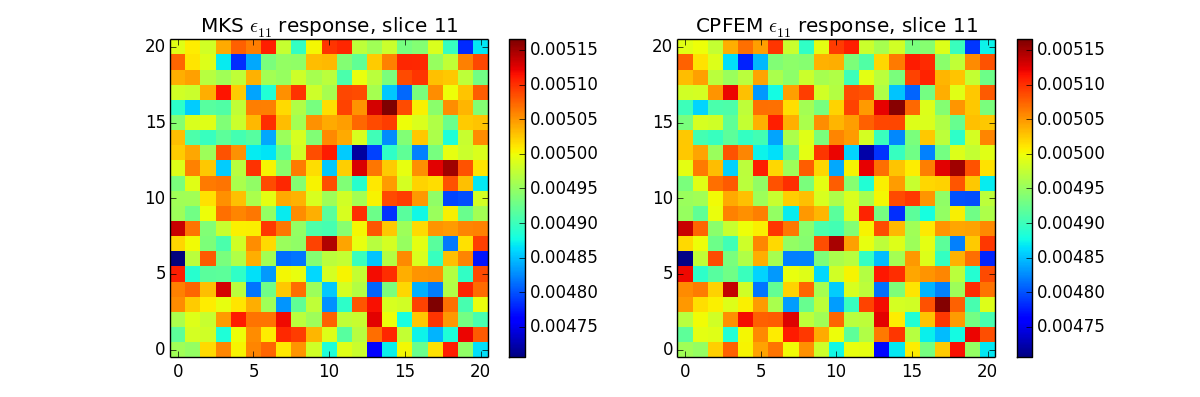
The image below shows a comparison of the strain fields between the MKS prediction and the CPFEM result for a single slice of a single validation microstructure
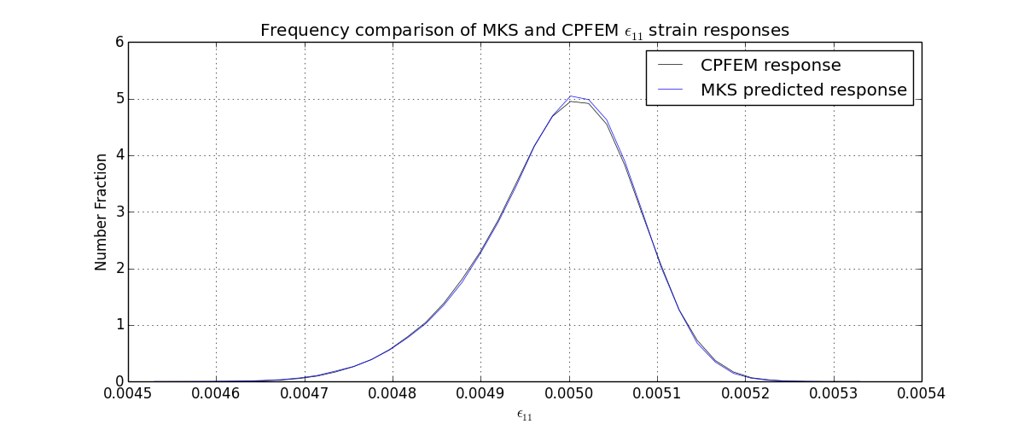
The histogram below shows a comparison of the between the MKS prediction and the CPFEM result
Stress Tensor Calibration for time-steps 1 through 6
The MKS calibration and subsequent validation were successfully performed for the full stress tensor (all components) over each step in the cyclic loading (steps 1 - 6)
The image below details the steps in the cyclic loading
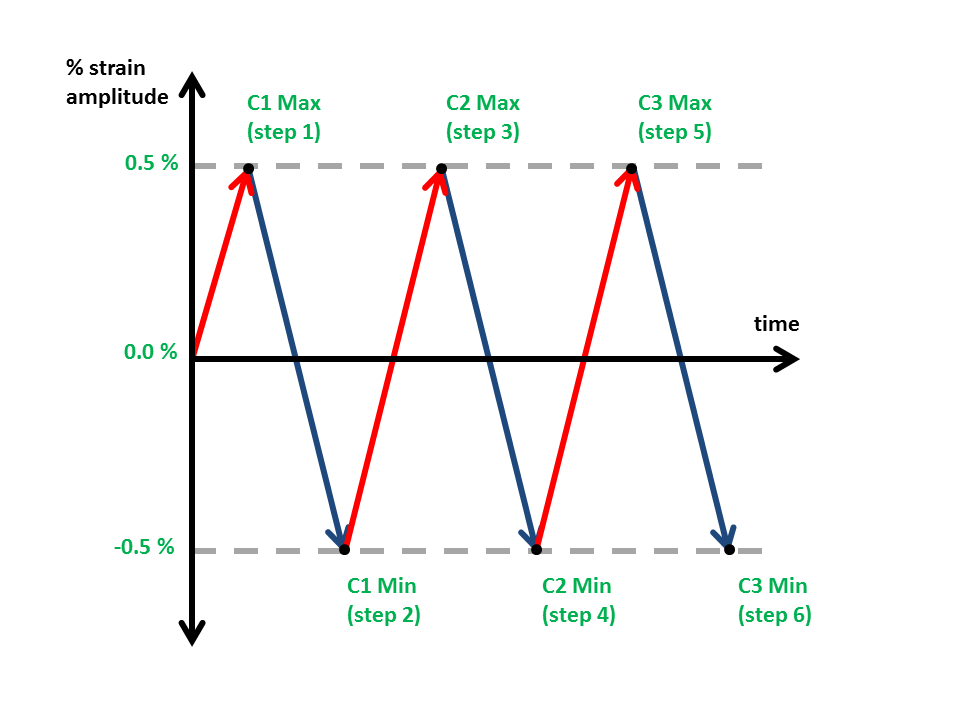
The graph below shows the error in the MKS prediction of the CPFEM stress fields during the first loading step
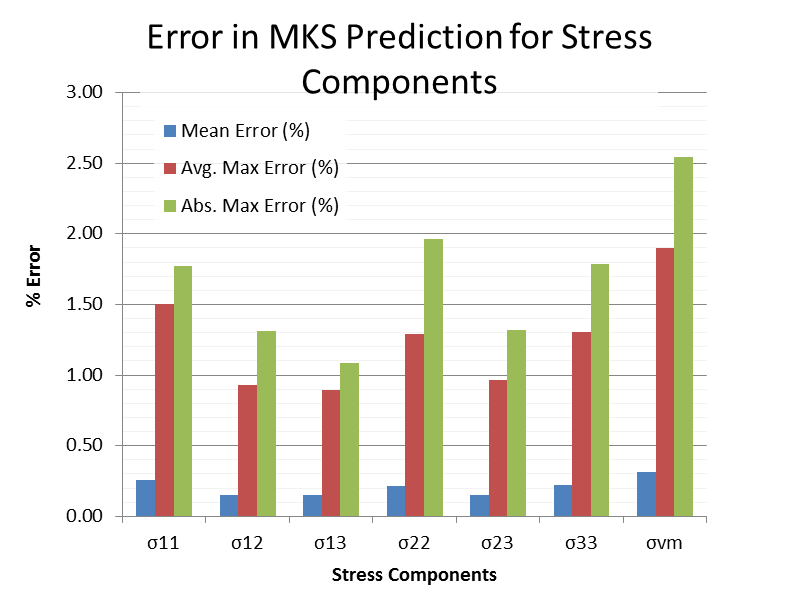
Three error measures are used; each is a measure of the difference in stress between identical voxels in the CPFEM results and the MKS prediction, divided by the mean von-Mises stress in the CPFEM response. This is in comparison to the error definitions in the strain calibration section, where the voxel difference was normalized by the CPFEM strain in the current voxel. The current error definition was chosen to allow for the comparison of errors between components, even when the stress values of certain components may be near zero. These three types of errors are detailed below.
- Mean Error: The error averaged over all voxels in all 50 validation microstructures
- Average Maximum Error: The average of the maximum error (on a voxel by voxel basis) seen in each validation microstructure
- Absolute Maximum Error: The maximum error value seen in any voxel in any of the validation microstructures
The graph below shows the difference in average maximum error between the minimum and maximum (i.e. step 1 vs step 2) locations in the cyclic loading
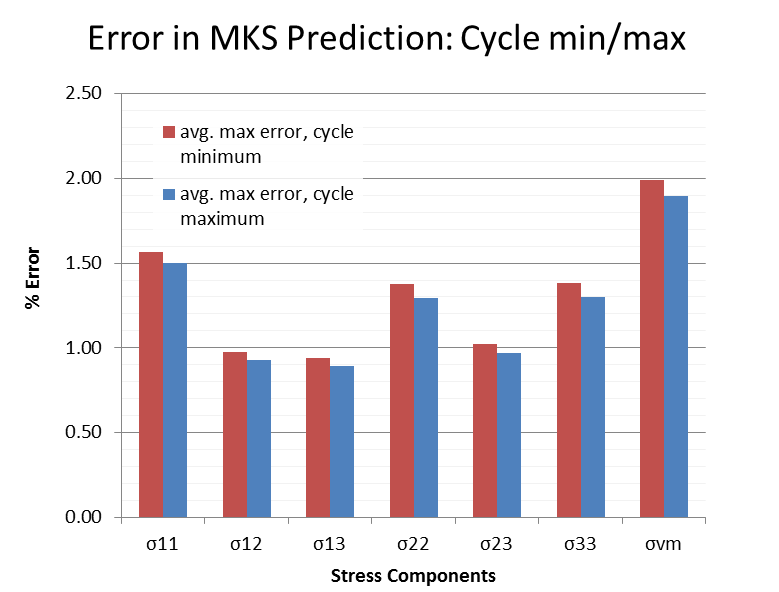
The reason these errors can be plotted this way is because the errors in each of the maximums and minimums are nearly identical to each other. In all cases the cycle minimum had a higher error than the cycle maximum.
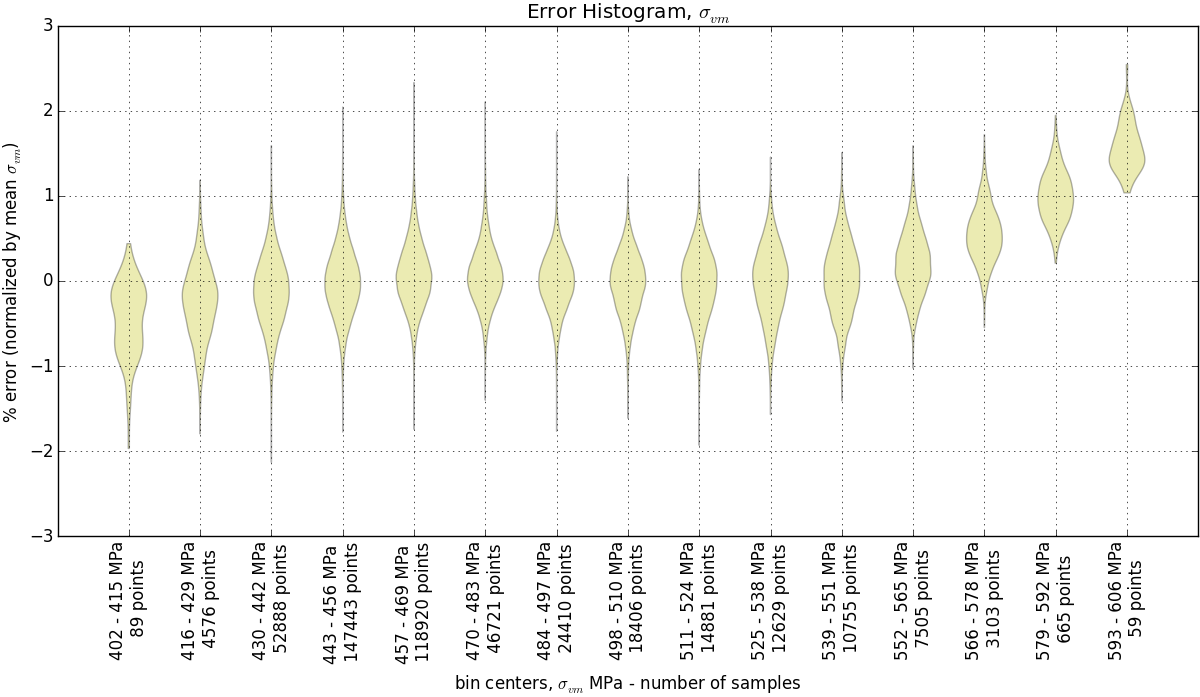
This final violin plot shows the error distributions for 15 bins of the von-Mises stress response, which range from the minimum to the maximum stresses in all voxels in the validation samples.
Zero-Padding for the Prediction of Large Microstructures
Next, the influence coefficients from the previous calibration for stress were zero padded and the response fields were predicted for some larger microstructures.
The following image compares the stress fields between the MKS prediction and CPFEM response of a 51x51x51 element microstructure. The microstructure was composed of 3x3x3 element ‘grains’ each with a randomly assigned orientation from the hexagonal fundamental zone (this particular structure was chosen for computational reasons).
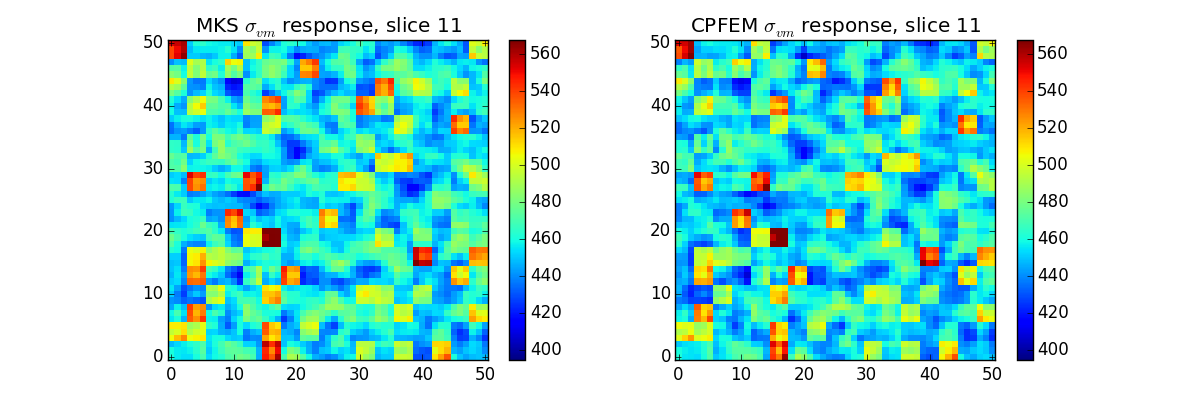
The errors are slightly higher with zero-padding (Mean error = 0.74%, Max error = 3.94%), but the response fields remain nearly identical in appearance.
The following chart compares the mean error, max error, and time to validate for different microstructure sizes using the zero-padding technique. These error measures were calculated for single microstructures for all stress components. The error was calculated from the von-Mises effective stress. All computations were performed on a desktop workstation with 4gb of RAM and an Intel i5 processor at 2.9 GHz.
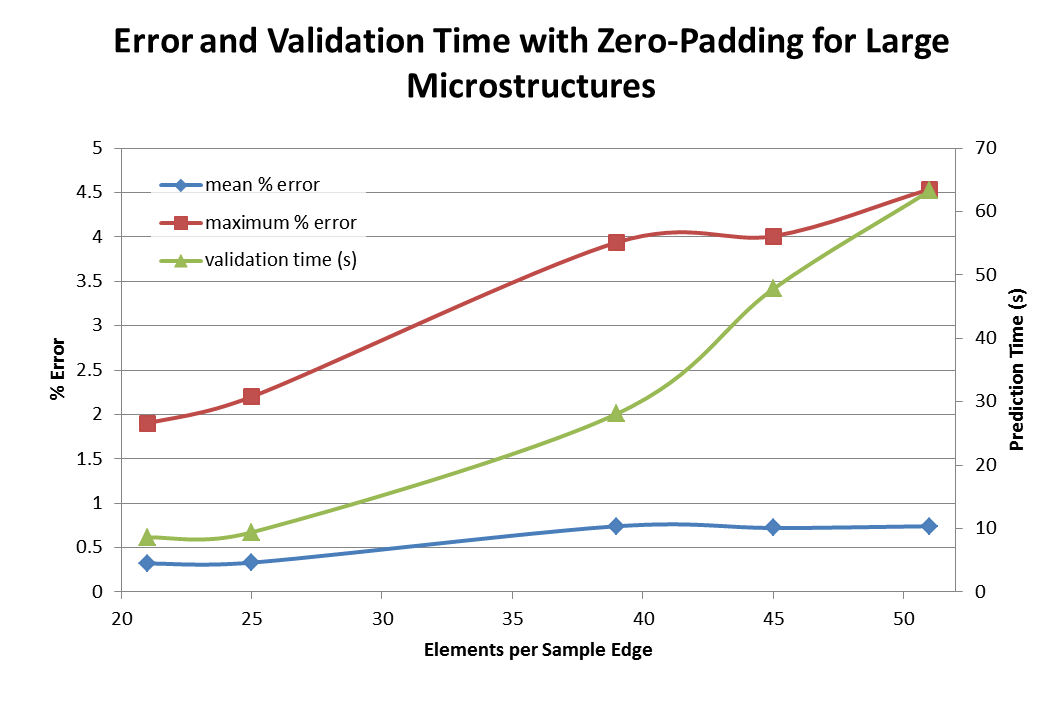
While the mean error stays low for all simulations, the maximum error tends to rise. The prediction time of the MKS also increases with the size of the microstructure, though a large share of this computational cost comes from reading the larger files.
Conclusions
The MKS was successfully calibrated and shown to predict the elastic (+ minimal plastic) response of random-grain polycrystalline alpha titanium to a high degree of accuracy.
Next Steps
- Calibrate the MKS to predict the response of realistic alpha-beta titanium microstructures
- Select appropriate set of microstructures for calibration
- Streamline the computations and analyze the efficiency of those computations.
- Pay particular interest in the comparison with CPFEM computational efficiency.
References
- Y.C. Yabansu, D.K. Patel, S.R. Kalidindi Calibrated localization relationships for elastic response of polycrystalline aggregates Acta Materialia 81 (2014) 151-160