CPFEM simulations of nanoindentation - ongoing research
Background
One of the major purposes of performing spherical nanoindentation experiments is for the further refinement of the CPFEM parameters. In the past, these parameters have been calibrated to polycrystalline cyclic loading data. However, spherical nanoindentation experiments can be performed on a single grain and thus represent a single crystal response to the deformation. This is advantageous for the calibration of low-symmetry crystal structures that have CRSS values that vary widely with slip system.
For reference, Patel and Kalidindi (2014) have successfully performed spherical nanoindentation FEM simulations that were used to extract the elastic stiffness tensor for FCC materials.
Initial FEM Meshes
Many 2D nanoindentation FEM simulations have been employed in the literature, but there are very few fully-3D simulations for nanoindentation (besides Patel and Kalidindi, 2014). In this work, fully-3D simulations are required to look at the elastic and inelastic response of HCP crystal structures (such as Ti-64) loaded in an arbitrary direction. As a side note, special loading directions with crystal symmetry would allow for the use of 2D simulations. As for mesh development, Dipen Patel and Dr. Kalidindi have been nice enough to allow us to use the meshing algorithm for spherical nanoindentation that was developed in his research. An example simulation schematic is shown below.
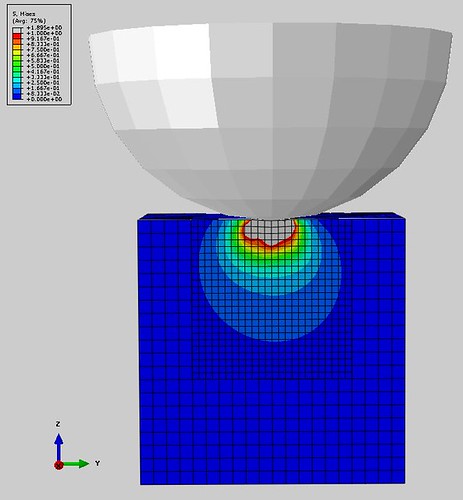
Before employing that meshing strategy, simple spherical nanoindentation CPFEM simulations were performed. The material region is a cubic volume with a constant mesh density in all direction and the spherical indenter is modeled as a regid half-sphere. The cubic volume has a sidelength of 20$\mu m$ and the mesh density varies from 20 to 50 elements per side (1$\mu m$ to 0.4$\mu m$ element sidelength).
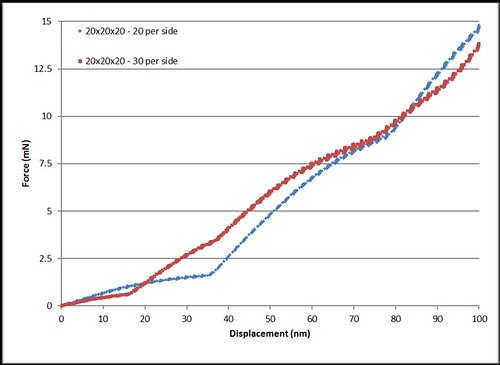
A comparison of the force versus displacement response for a mesh with 20 elements per side and a mesh with 30 elements per side is shown in the figure below. It is important to note the response has a slight oscillation. This is most likely due to a lack of mesh refinement directly beneath the indenter. As the material beneath the indenter deforms plastically, the stiffness of the overall response decreases. But, when additional material is engaged by the indenter, it is elastically deforming, thus increasing the stiffness.
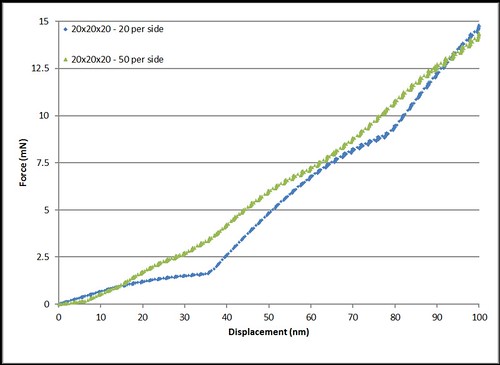
As the mesh is further refined, the oscillation becomes less apparent, as shown in the force versus displacement curve for the mesh with 50 elements per sidelength.
In terms of computational time and resources, the mesh with 20 elements per side (total of 8,000 elements) took approximately 9 hours to complete with 4 processors. In contrast, the mesh with 50 elements per side (total of 250,000 elements) took approximately 64 hours to complete with 24 processors.
The purpose of this study is to compare the indentation stress-strain responses from experiments with those from CPFEM simulations to better inform the model parameters. However, the indentation stress-strain curves for these simulation results are of no use, most likely because of the lack of mesh refinement directly beneath the indenter.
FEM Mesh with Multiple Regions
The results in the previous section indicate a finer mesh density is needed below the indenter tip. Therefore, the mesh construction method employed in Patel and Kalidindi (2014) is used in this section. The meshes range from 2- to 4-regions, with each region having a higher mesh density. The element length is cut in half for each successive region. An example of the 4-region mesh is shown below.
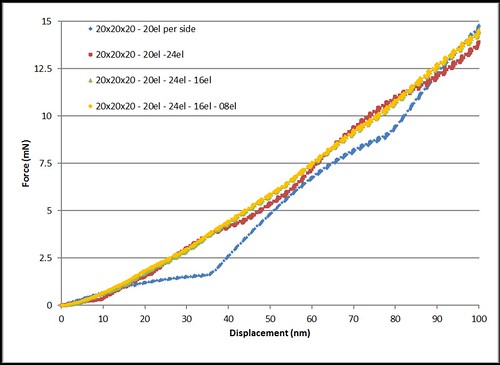
In the 4-region mesh, the elements in the most outer region have a sidelength of $1.0\mu m$ and the elements in the most inner region has a sidelength of $0.125\mu m$. Moving from outer to inner regions, the inner region has an element sidelength that is half of the element sidelength of the outer region. The force-displacement curves for the various regions are shown below. The constant mesh density curve (blue) is shown as a benchmark for the other meshes. The oscillation is less in the 2-region mesh (red), while the 3-region (green) and 4-region (orange) mesh curves show little difference.
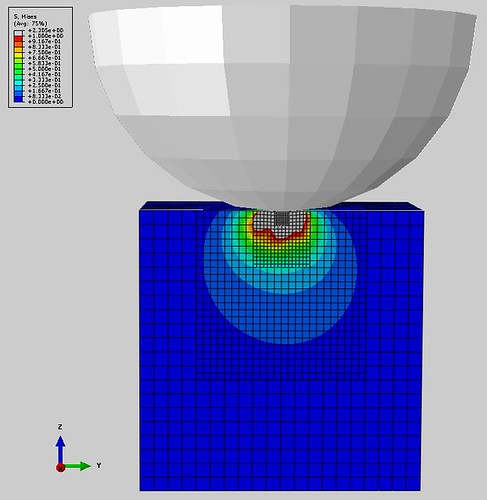
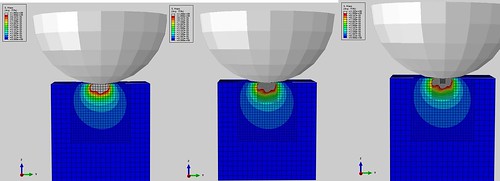
By comparing the 2-, 3-, and 4-region mesh responses, some light can be shed on the increased mesh density beneath the indenter tip. At first glance, the von Mises stress for each mesh looks very similar. However, the peak value increases from 1.90 GPa (2-region mesh, left) to 2.30 GPa (4-region mesh, right).
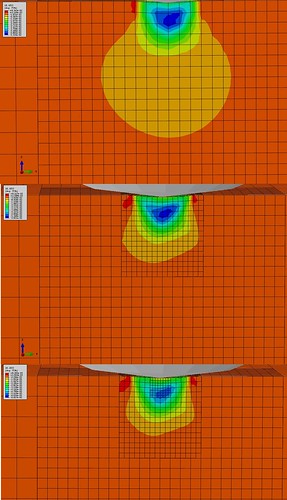
Additionally, by looking at the strain component in the loading direction, it is revealed that the peak strain values increase with mesh density. The maximum compressive strain is 0.0532, 0.0593, and 0.0666 in the 2-region mesh (top), 3-region mesh (middle), and 4-region mesh (bottom), respectively.
The stress-strain data for these 2-, 3-, and 4-region meshes were erroneous and thus, not shown.
In terms of computational time and resources, the 2-region mesh (20,097 elements) took approximately 8 hours to complete with 8 processors, the 3-region mesh (23,681 elements) took approximately 14 hours with 8 processors, and the 4-region mesh (24,129 elements) took 16 hours with 8 processors.
More detailed look at the 2-region mesh shown above
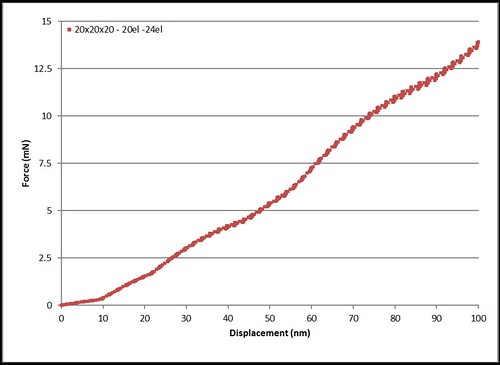
The force v. displacement curve for the 2-region mesh is shown below; notice there is a distinct slope change at approximately 10nm.
A video of the simulation results was made with two viewports: one from the top surface where the indenter impacts the material and the other is a side contour directly beneath the indenter. Each odd number step corresponds to an indenter displacement of 2nm into the material and an even number step is a slight unload. Therefore, a displacement of 10nm will occur at the end of step 10, step 11 is a slight unload, and step 12 will increase the displacement to 12nm.
Moving forward
It is apparent from these results the mesh density still needs additional refinement directly beneath the indenter. I plan to:
- Explore finer meshes while also trying to balance simulation run time. Dipen’s latest simulations have shown that an element size of approximately 5nm is needed to resolved the stress gradient at the indenter tip.
- The experimental data is actually generated with force-controlled BCs and right now the simulations have displacement-controlled BCs. Implementing force-controlled would allow us to match the loading rate of the experimental data.
- In order to limit the number of elements in the simulation, we are also considering using wedge and cylindrical elements instead of brick elements. This would provide us with greater mesh control and also remove the MPCs, which are also slowing the simulations.