How much do we rely on the CSM measurement for the Indentation Stress-Strian Analysis?
Background
Kalidindi and Pathak (2008) developed a method for extracting nanoindentation stress-strain curves from load, displacement, and continuous stiffness data which allows for the recovery of the initial elastic loading and elastic-plastic transition. The method relies on determining and applying a zero point correction to the load and displacement signals. The zero point correction is needed because the initial stage of contact is messy: the machine zero point is only an estimate and imperfections in sample and tip are magnified at such small areas of contact causing deviations from Hertz Theory for the given assumption of a flat surface and a spherical tip with a known radius. The new zero point is not the true zero point of initial contact, rather an effective zero point based on reliable data after the initial stage of contact that is well described by Hertz Equation.
Theory
Hertz Theory for a spherical indenter on a flat sample surface:
\begin{equation} a=\sqrt{R_{eff}h} \end{equation}
\begin{equation} \frac{1}{R_{eff} }= \frac{1}{R_i} + \frac{1}{R_s} \end{equation}
The indenter properties (diamond) are $E_i = 1140 GPa$ and $\nu_i = 0.07$, and the sample radius of curvature is $R_s = \infty$ making $R_{eff} = R_i$ provided that no plastic deformation occurs.
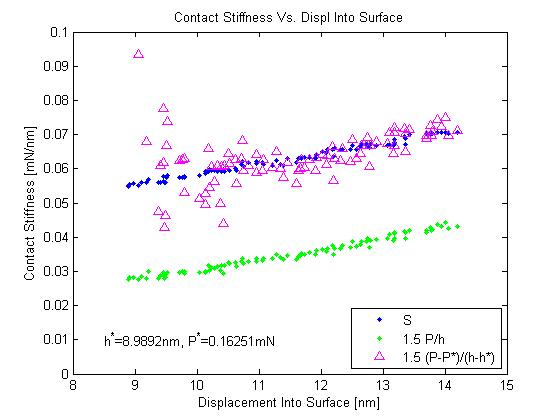
Stiffness is defined by $S=\frac{dP}{dh}$. If we take the derivative of Equation 1 with respect to displacement we can arrive at
Substituting Equation 1 back in for the part in parenthesis and simplifying yields
For an indentation test using the CSM, all three signals are collected: load, displacement, and harmonic contact stiffness. The right and left hand side of the equation should agree during the initial elastic loading of the material.
Some things to note:
- This relationship is independent of the sample material and curvature as well as the tip material and curvature as long as both surfaces can be described with radii of curvature.
- After plasticity occurs this relationship no longer holds because the total displacement is no longer the elastic displacement.
- Stiffness is independent of the machine zero point while load and displacement depend on the determined zero point.
We address the discrepancy of the raw data for Equation 6 (see example below in Results) by correcting the right hand side of the equation (load and displacement) so that it agrees with the left for the elastic loading portion of the test.
The corrections are found through a linear regression where and are the load and displacement corrections. $P$ and $h$ are the load on sample and displacement into surface channels and S is the harmonic contact stiffness channel.
Rearranging into a convenient form for linear regression
After the corrections are applied to the load and displacement channels, a linear regression of Equation 1 between and can be done to extract the effective modulus.
The next step to get to indentation stress and strain is calculating the contact radius from the effective modulus and harmonic contact stiffness.
From here, indentation stress and strain can be calculated as defined in Kalidindi and Pathak 2008.
Results
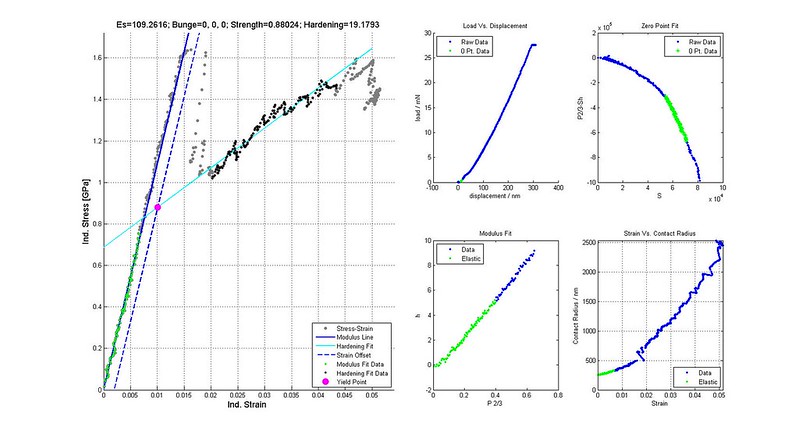
The plot below illustrates the use of the harmonic contact stiffness and the relationship between all three signals in the elastic loading regime in determining the zero point correction.
For this particular test and analysis, the load on sample and displacement into surface curve, the two linear regression plots, and indentation stress-strain plot are shown. The selected elastic segment is highlighted in green on each plot.
Discussion
Q1: How sure are you that the segment you selected is elastic loading?
A1: When we do full unloading at this stage of the test, we get elastic recovery i.e. the unloading follows the loading curve
Q2: How sure are you that the tip is spherical with the prescribed radius and the surface is flat?
A2: The tip is imaged using an SEM and measured by fitting a sphere to the spherical region. The surface is also in an SEM which provides some qualitative measure of flatness. Both assumptions are indirectly validated by doing experiments on a material with a known elastic modulus (Aluminum and/or Tungsten) and obtaining the expected value.
Q3: Why haven’t you used any corrections to load, displacement, and harmonic contact stiffness as proposed by Pharr et al. 2009?
A3: Using the corrections was explored by S. Vachhani et al. (2013) and determined to have little effect on the indentation stress-strain curve. However it is still being explored as it may effect the determination of the optimal zero point correction.
Q4: From an instrumentation point of view, is there anything that explains the discrepancy in the relationship between the three signals for Equation 6: load, displacement, stiffness during elastic loading?
A4: Unknown - please comment
Q5: Is the zero point correction sensitive to small errors in the harmonic contact stiffness? i.e. Harmonic stiffness is not zero in air during the approach.
A5: Unknown, working to answer this question.
Q6: Can we zero the harmonic contact stiffness at the start of the test to account for any error in the measurement that appears in air?
A6: Unknown - please comment
References
Kalidindi, S.R. and S. Pathak. “Determination of the effective zero-point and the extraction of spherical nanoindentation stress–strain curves.” Acta Materialia. 2008.
Pharr, G.M., J.H. Strader, and W.C. Oliver. “Critical issues in making small-depth mechanical property measurements by nanoindentation with continuous stiffness measurement.” J. Mater. Res. 2009
Vachhani, S.J., R.D. Doherty, and S.R. Kalidindi. “Effect of the continuous stiffness measurement on the mechanical properties extracted using spherical nanoindentation.” Acta Materialia. 2013
Data
Click here to access the raw data and some additional files.
The analysis and plotting was done in Matlab. An explanation and all codes used is not provided here.
Experiment Details
A 16.5 micron radius conical spherical diamond tip was used on an Agilent G200 nanoindenter with the XP head. The basic CSM test method was used with 2nm, 45Hz and a target strain rate of 0.05 s-1. The sample was commercially pure titanium with an electropolished surface mounted in epoxy.