MKS for Plastic Deformation of a 2 Phase Composite
Introduction
The purpose of this study was to investigate the prediction of total strain using the MKS framework. Two - phase composite microstructures with isotropic phases were chosen to simplify the problem. The goal was to calibrate with plastic FEM simulations and predict the total strain at each voxel location (elastic strain + plastic strain).
Study 1
Parameters
- 2 phase microstructures with isotropic phases
- Both phases exhibit elastic, perfectly plastic behavior
- 0.1125% applied strain amplitude
- Periodic boundary conditions
- uniaxial tension
- contraction not allowed on transverse sides of MVE (BCs for elasticity)
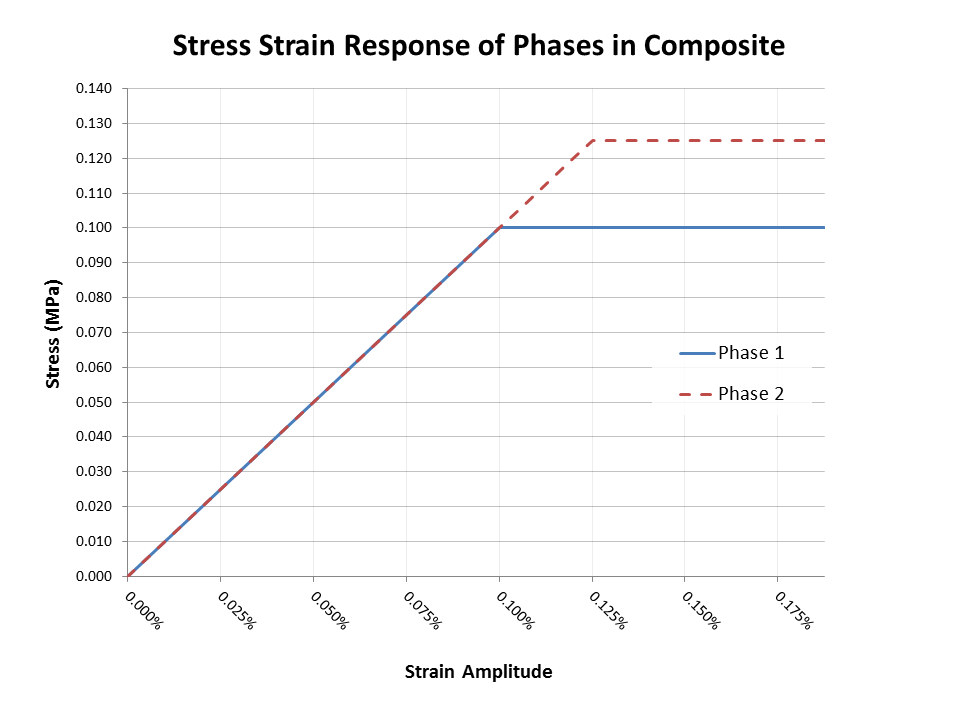
Phase 1 Parameters:
- Young’s Modulus: 100 GPa
- Poisson’s Ratio: 0.3
- Yield Strength: 125 MPa
Phase 2 Parameters:
- Young’s Modulus: 100 GPa
- Poisson’s Ratio: 0.3
- Yield Strength: 100 MPa
The following image shows the stress-strain curves for both phases superimposed
Calibration Set:
- 50% volume fraction
- 50 random microstructures
Validation Sets:
- 3 sets: 30% VF, 50% VF, 70% VF
- 10 random microstructures in each set
Results
The following chart shows the errors seen in the 10 validation microstructures

- Mean % Error: mean error per voxel in all microstructures
- Average Maximum % Error: max error per microstructure
- Absolute Maximum % Error: max error in any microstructure
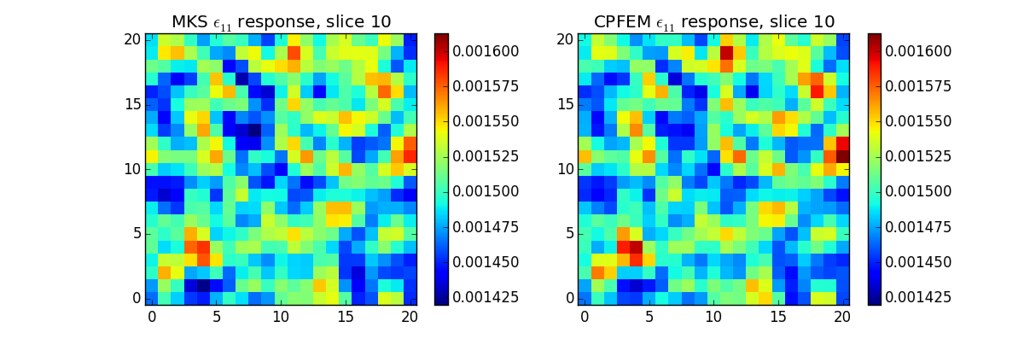
The following image compares a slice of a strain field for a 50% VF validation microstructure between the MKS and FEM
Study 2
In this study a number of parameters were changed. Notably, the periodic boundary conditions were changed to allow lateral contraction, and both calibration and validation microstructures were generated with a range of phase volume fractions. In addition, both 1st and 2nd order terms in the MKS series were utilized to produce the results.
Parameters
- 2 phase microstructures with isotropic phases
- Both phases exhibit elastic, perfectly plastic behavior
- 0.10625% - 0.18750% applied strain amplitude
- Periodic boundary conditions
- uniaxial tension
- contraction allowed on transverse sides of MVE (BCs for plasticity)
Phase 1 Parameters:
- Young’s Modulus: 100 GPa
- Poisson’s Ratio: 0.3
- Yield Strength: 125 MPa
Phase 2 Parameters:
- Young’s Modulus: 100 GPa
- Poisson’s Ratio: 0.3
- Yield Strength: 100 MPa
Calibration Set:
- 200 random microstructures
- Volume fractions equally dispersed between 1% and 99%
Validation Sets:
- 50 random microstructures
- Volume fractions equally dispersed between 1% and 99%
Results
The following chart shows the errors versus applied strain

Notice the increasing linear relationship of error vs. strain amplitude until the macroscopic strain at yield for the hard phase is reached (0.125% SA). This is expected because the contrast in the strain values between the hard and soft phases increases with increasing applied strain. After both phases yield (macroscopically) the mean error begins to drop. This result is expected as when both phases yield the contrast in strain responses decreases with increasing strain. It is not clear, however, why the average maximum error continues to increase after both phases reach macroscopic yield.
- Mean % Error: mean error per voxel in all microstructures
- Average Maximum % Error: max error per microstructure
The following image compares a slice of the strain fields for a validation microstructure between the MKS and FEM at 0.1125% SA

Notice the odd shapes of the distributions for the two phases. While the strain distributions for composites with fully elastic constituents tend to be “normal” in shape, these distributions are more skewed. The distribution for the soft phase shows a distinct skew towards high strain, as would be expected when many voxels undergo plastic strain.
Study 3
In this study realistic microstructures were used in both the calibration of the MKS influence coefficients and in the validation of the MKS predictive capability. These microstructures were generated using a Voronoi tessellation technique for a range of grain sizes and phase volume-fractions. The MKS procedure was performed with 1st order terms and 2nd order terms (where the local state of each nearest neighbor cell is incorporated into the higher-order local state descriptions), though the results were not substantially improved with the inclusion of higher order terms. In any case, 2nd order terms were used to produce the final results. Finally, plastic strains were calculated and compared between the FEM and the MKS predictions, giving good results.
Parameters
- 2 phase microstructures with isotropic phases
- Both phases exhibit elastic, perfectly plastic behavior
- 0.1125% applied strain amplitude
- Periodic boundary conditions
- uniaxial tension
- contraction allowed on transverse sides of MVE (BCs for plasticity)
Phase 1 Parameters:
- Young’s Modulus: 100 GPa
- Poisson’s Ratio: 0.3
- Yield Strength: 100 MPa
Phase 2 Parameters:
- Young’s Modulus: 100 GPa
- Poisson’s Ratio: 0.3
- Yield Strength: 125 MPa
Calibration Set:
- 400 Voronoi microstructures with equiaxed grain structure
- Volume fraction between 5% and 95%
- Large range of grain size
Validation Sets:
- 190 Voronoi microstructures with equiaxed grain structure
- Volume fraction between 5% and 95%
- Large range of grain size
Results
1st Order Terms
- Mean Error: 0.589
- Average Maximum Error: 4.507
- Absolute Maximum Error: 7.539
2nd Order Terms
- Mean Error: 0.486%
- Average Maximum % Error: 4.008%
- Absolute Maximum % Error: 7.073%
The following image shows a slice of the microstructure, the FE strain field and the MKS prediction of the strain field given the original microstructure:

References
- S.R. Kalidindi, S.R. Niezgoda, G. Landi, S. Vachhani, T. Fast A Novel Framework for Building Materials Knowledge Systems CMC 17 (2010) 103-125
- T. Fast, S.R. Kalidindi Formulation and calibration of higher-order elastic localization relationships using the MKS approach Acta Mat. 59 (2011) 4595-4605